
 household debt/GDP vs household debt/disposable income.
Malaysians struggle as household debt soars
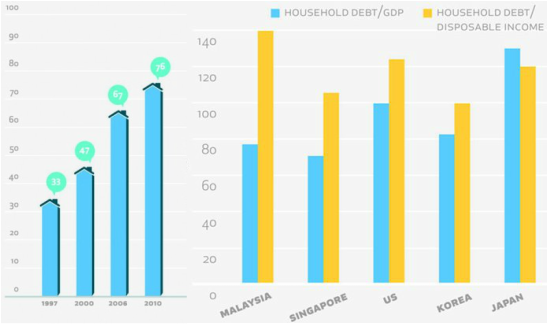
It is not just household debt as a percentage of GDP that we should be concerned about, but household debt compared to disposable income is even more crucial. Take a look at the yellow bar to see where we stand.
While our household debt as a percentage of GDP of 78 per cent may not be exceptionally high, our household debt to disposable income of 140 per cent is worrying.
Household debt to disposable income for selected countries:
Now you know why many Malaysians don’t feel so well off, with this level of household debt. About half our disposal income goes to servicing debt.
What are some of the factors driving the high household debt/disposal income ratio?
It is not just household debt as a percentage of GDP that we should be concerned about, but household debt compared to disposable income is even more crucial. Take a look at the yellow bar to see where we stand.
While our household debt as a percentage of GDP of 78 per cent may not be exceptionally high, our household debt to disposable income of 140 per cent is worrying.
Household debt to disposable income for selected countries:
- UK – 176% (2007)
- Malaysia – 140%
- US – 130% (2008)
- Japan – 120%
- Singapore – 105%
- Korea – 101%
- Germany – 95%
- France – 93%
- Italy – 70%
- Thailand – 53%
- Indonesia – 38%
Now you know why many Malaysians don’t feel so well off, with this level of household debt. About half our disposal income goes to servicing debt.
What are some of the factors driving the high household debt/disposal income ratio?
- High growth in consumer-driven spending
- Low interest rates encourage borrowing
- East credit by banking institutions due to financial liberalisation (translating into fat profits for the banks?!)
- Rising house prices especially in KL and Penang where the average house price to average income ratios are much higher
- and of course, low income/wages